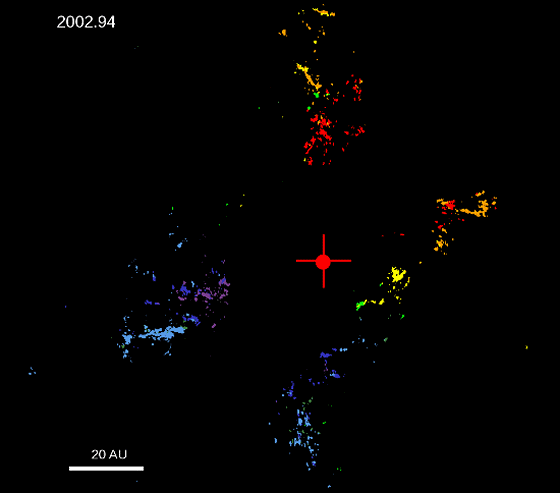
Image created from real data collected by Matthews' team showing the motions of gas clumps around Source I over the course of 22 months. The gas emission is color-coded according to the velocity of the material.
Credit Matthews et al.

| Post Info | TOPIC: massive stars | ||||||
|---|---|---|---|---|---|---|---|
|
|
|
||||||
|
|
|
||||||
|
|
|
||||||
|
|
|
||||||
|
|
|
||||||
|
|
|
||||||
|
|
|
||||||
|
|
|
||||||
|
|
|
||||||
|
|
|
||||||
|
|||||||
|
|
||